50% higher conversion rate in 30 days: with 8,337 fewer visitors.
Palazzo Couture had traffic and had interest. Only 7 in every 1,000 visitors bought. The tracking was broken, so nobody could see where the money was going.
Jun 15 to Jul 15 vs the previous 30 days · Shopify Analytics
What changed at Palazzo Couture?
The engagement rebuilt broken tracking, cut full page load from 18.5 seconds to 4, rebuilt the buying path, and moved trust information to the points where shoppers were hesitating.
Conversion rate rose from 0.72% to 1.08%. Gross sales rose from $37,323 to $43,417. Average order value rose from $75.41 to $83.70 in a period that received fewer sessions than the month before.
Palazzo Couture is a DTC fashion brand on Shopify. Ads were running. Traffic was arriving. People were browsing.
Around 76% of them bounced. Sessions barely lasted a minute. Conversion rate sat at 0.72%.
The deeper problem was that nobody could tell why. The dashboard was reporting events that never happened and missing ones that did. Every decision the team made was a guess dressed up as data.
Four connected leaks
Leak 1: Tracking was broken top to bottom
Core events and pages were not measured consistently. Google's tag quality report flagged untagged pages and an unsupported Shopify implementation. The reports could not support a decision.
Leak 2: The store was slow
5.5 seconds before anything meaningful appeared. 18.5 seconds for a full load. On mobile, that is the entire decision window, gone.
Leak 3: Six apps fighting each other
Background apps were adding weight and creating script conflicts. Some were doing the same job twice.
Leak 4: Pages built to look good, not to sell
The homepage, product pages, cart and menu were polished. None of them guided a ready buyer toward checkout. The path existed, but nothing pointed at it.
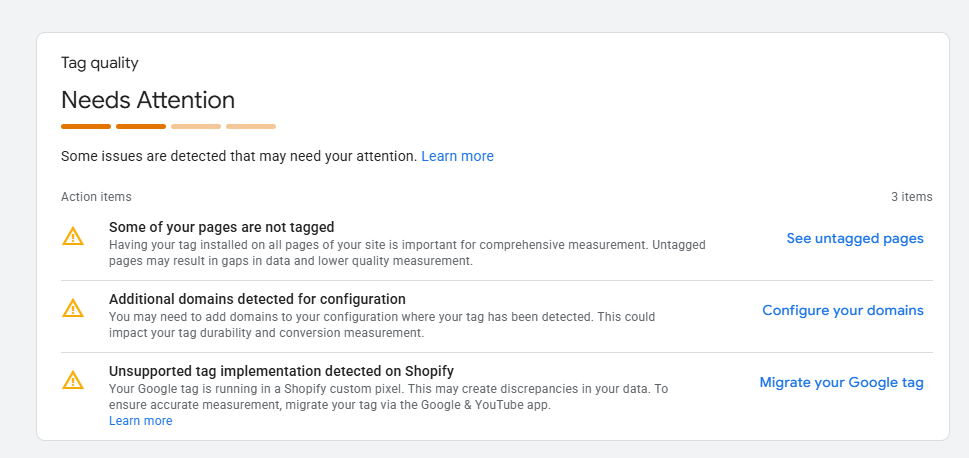
Google tag quality report: "Needs Attention"
Fix the foundation, then remove the friction
1. Rebuilt tracking from scratch
Reconfigured GA4, GTM and the Shopify integration, then verified every important event by hand. This came first because nothing after it means anything without it.
2. Made the store fast
First view: 5.5s → 1.7s. Full load: 18.5s → 4.0s. Image compression, deferred scripts, removal of render-blocking assets.
3. Removed six competing apps
Cut the apps duplicating work or conflicting with each other. Kept what earned its place.
4. Rebuilt the buying path
Homepage, product pages, cart and menu rebuilt around one job: let a ready buyer reach checkout with nothing in the way.
5. Moved trust to the point of hesitation
Session data showed where shoppers paused. Reassurance, proof and policy information moved to those exact points.
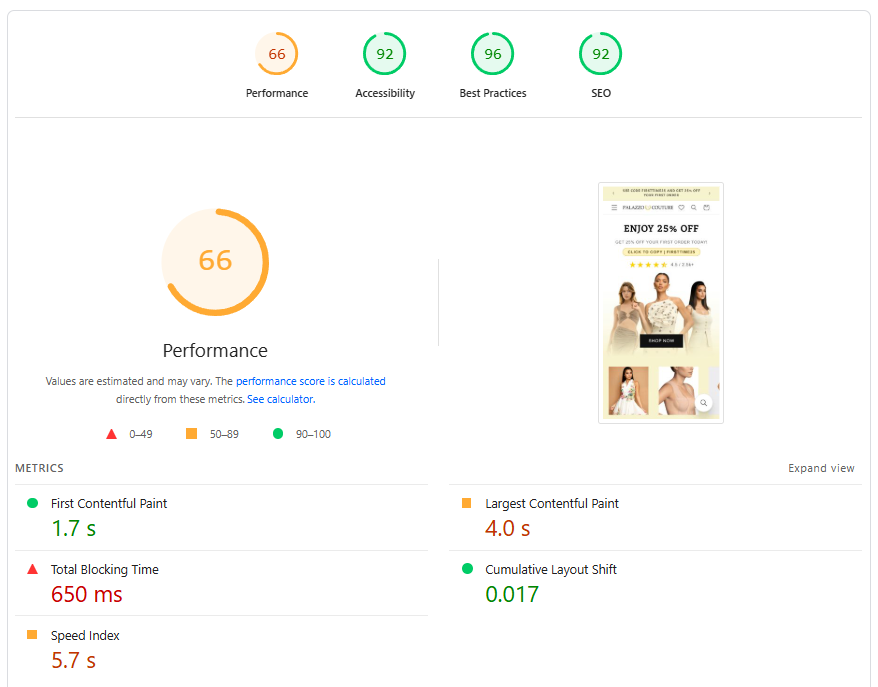
PageSpeed report after: FCP 1.7s, LCP 4.0s
The verified results
+50% relative lift
+16.3% · $6,094 more revenue
+11.0% increase
−5.5% relative reduction
More revenue. 8,337 fewer sessions. That is not a traffic story. That is a conversion story.
Want a breakdown of your store's biggest leaks?
Get a direct walkthrough of where your Shopify store is losing qualified buyers and what to fix first.
About those 8,337 fewer sessions
It is a fair question, so here is the straight answer.
Sessions dropped during the comparison period. That gave the conversion rate a smaller denominator, and part of the percentage lift reflects that.
But gross sales rose in absolute dollars: $37,323 to $43,417. Fewer people came, and $6,094 more came in. A smaller denominator cannot produce that. That only happens when more of the people who arrive decide to buy.
Two more things worth saying plainly. This was a before-and-after comparison, not a controlled A/B test: traffic volume did not support one. And every change shipped inside the same 30 days, so no single fix owns the result.
I would rather hand you the caveat than have you find it.
Founder Feedback
"Sales went up 50% in the first month. We had 8,337 fewer visitors, and still sold more. Same products. Same ad spend."
José Moreno · Palazzo Couture
What this case study actually shows
Traffic volume does not explain ecommerce growth. Palazzo got less traffic and more revenue in the same period.
The useful part is the sequence. Verify the data. Diagnose the behaviour. Fix the biggest leak first. Measure what moved.
Every engagement on this site runs the same order. Tracking goes first, because a store optimizing on bad data is only guessing faster.
More case studies

How Mosaibul Rebuilt Sofá na Caixa's Mobile Flows to Add R$690,000+ in Net Revenue
